Data loggers for paranormal investigation
Logging history
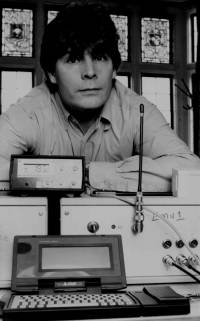
The idea of collecting several channels of data simultaneously at haunted locations is not new. Back in the 1980s, Tony Cornell of the SPR, built; SPIDER (Spontaneous Psychophysical Incident Data Electronic Recorder) which contained an array of sensors and cameras triggered by infra-red. In 1992, ASSAP’s Tony Wells constructed EMU1 (Environmental Monitoring Unit). This, too, took the output from several different sensors but only after it was triggered by some event (a change in readings from a sensor). Sadly, both machines recorded very few ‘events’ despite being deployed for long periods of time. These efforts were before the days of cheap, powerful, easy to use computers.
Since then several groups have built similar devices. With the advent of fast computers, it has become easier to continuously monitor sensor data rather than wait for trigger events. Computers now generally form the heart of such sensor arrays.
Data loggers
Data loggers are becoming increasingly common in paranormal, usually haunting, research. A data logger is a device for collecting data over time from several channels simultaneously. If you are trying to monitor a haunted location to look for unusual environmental changes, particularly when they correspond to ghost sightings, data loggers are clearly worth considering.
Data loggers are available commercially in various different configurations. Most need to be connected to a computer and (almost certainly) all can be. Certainly, you will need a computer to make sense of the readings.
General purpose data loggers
Some general purpose data loggers just monitor voltages on input channels. You can, therefore, connect them to any instrument with an output that supplies analogue voltages, usually proportional to readings. This sort of setup will generally require some sort of technical knowledge. In particular, you will need to calibrate the setup by seeing what voltages equate to what readings. It is not enough, unfortunately, simply to use figures from a supplied specification as these may vary.
Some data loggers may accept digital (rather than analogue) input directly from instruments. However, you may need to understand IT issues when using such equipment. The advantage of general purpose loggers is that you can connect them to existing instruments. The disadvantage is that you may need technical expertise to connect them up.
Pre-configured data loggers
Other data loggers come complete with sensors already attached and calibrated. This is obviously much easier for people who do not wish to dabble in technical issues. However, it does mean that you are limited to the supplied sensors which may not be as accurate, sensitive or have a high enough sample rate for your purposes. It may mean that you end up buying additional sensors that duplicate ones you already own. By shopping around, you may be able to find data loggers with sensors which match your existing individual sensors. Make sure, however, that there are full specifications available for the individual sensors packaged with your data logger.
Software
Most, if not all, data loggers come with data acquisition software. This may display data graphically (eg. spectrum analysis) or give it to you in a format where you can load it into a spreadsheet to do your own analysis.
One possible problem is ensuring the data isn’t arriving too quickly for your computer. If the software allows you to insert time-stamps in the data, you can check it to see if you are getting all the data at the rate you expect.
spectrum analysis
Many data loggers include spectrum analysis software. Indeed, you can get ‘spectrum analysers’ which are similar to data loggers but are single instruments that analyse just one physical quantity.
Spectrum analysis is a way of seeing the frequency contributions that make up a signal. For instance, if you get a reading of 50nT magnetic field on an EMF meter, which usually means 50nT at mains frequency (see here). However, because of the frequency response of the meter, it could equally be 5nT at 1000 Hz! Or it could be a combination of two or more frequencies. With spectrum analysis we can see what is really happening.
Spectrum analysis is not as straightforward as it may seem, owing to some issues that arise from DSP - digital signal processing (ie. turning analogue outputs from instruments into digital signals for computer processing).
For a start, your sensor, as well as the logger and computer, must all sample at twice the rate of the highest frequency you want to measure. This is defined by the Nyquist criterion.
Secondly, unless your sensor has a flat frequency response, you may get exaggerated or diminished results for particular frequencies. As illustrated above, EMF meters, for instance, rarely have a flat frequency response.
Then there is aliasing to consider. If you are sampling up to frequency ‘N’ Hz, you can get frequency spectrums up to ‘N/2’ Hz. However, your instrument may still pick up higher frequencies, which can affect readings in the range you are sampling. This is aliasing.
To stop aliasing, you need to insert a frequency filter (set at your highest sample rate) in the sensor (ie. before it is converted to digital data). Aliasing cannot be removed once the signal has been converted to digital.