Stock market and ESP

Three Bags Full Sir!
Laboratory experiments to test psi are based on statistics. Only if, over a number of runs, a participant apparently produces a final score that differs significantly from chance is the action of psi inferred. In this study, Hugh Pincott examines whether the stock market, which experience suggests should be random over a short period of time, could also be influenced in some way by those participating in it.
Abstract
Gains or losses for 2571 company shares quoted on the London Stock Exchange were calculated after one year and the results expressed as a ‘bagger ratio’ (if a price doubled, its bagger ratio is 2, if it trebled, 3 ... ). These ratios were grouped into discrete intervals and a distribution curve plotted. The results were astoundingly different from chance expectation, 20 % of them lying in fat tails outside the core Gaussian model. The observed probability of these anomalous extreme financial events ties in well with odds against chance for scores in Zener card and Random Event Generator tests, prompting speculation that emotion might be a key factor in operation of both financial markets and psi tests. An experiment is suggested to test this hypothesis, and the implication of its success could have serious consequences for the traditional calculation of results in parapsychology.
Hard rock
Chance is immutable and immovable and the rock-set universal laws of mathematics govern, if not suffocate, our everyday life and prospects. Longfellow reminds us all too poetically of the Second Law of Thermodynamics:
Art is long and time is fleeting
And our hearts, though stout and brave
Still like muffled drums are beating
Funeral marches to the grave.
Yet hope springs infernal in the human breast, with anecdotal - and indeed occasional experimental - evidence suggesting we can sometimes beat the odds stacked against us. But can we change what seems to be preordained destiny? Can we, by conscious effort, demonstrably advance ourselves in this life and improve our prospects for eternity?
Many traditional scientific psi tests from J B Rhine onwards suggest that some individuals can score markedly above chance in Zener card guessing tests (attempting to predict which of five symbols a card contains). For example, star subjects have obtained very high scores, in some instances with a probability of 1022 against chance expectation (Rhine, 1934, Irwin, 2004 pp 61-65). Experimental procedures have been refined greatly over the years, with ‘random event generators’ (REG) taking the place of shuffled card packs. Usually REGs are based upon entirely unpredictable happenings like emissions from a radioactive source.
And still reports are published suggesting certain people can either predict or influence which of four lamps will light at a particular instant, with odds again exceedingly high against chance expectation. A trillion (109) to one is not uncommon but, unlike the card-guessing experiments, there appear to be no star performers. The ability to influence an REG is relatively small, but consistent, across individual trials and individual subjects (Irwin, 2004, pp 107-110; Roy, 1998; Fontana, 1998). (Note: for simplicity ‘prediction’ will be equated with ‘influence’ in this paper. Either the target is interfered with or time is twisted. Whichever way the result might occur, poor old chance gets bashed!)
Some recent research also suggests that elements of emotion linked with subjects or the targets they are trying to perceive can influence the success rate in psi experiments (Lumsden-Cook, 2005).
So unless we choose to ignore entirely the thousands of well-controlled experiments, and thousands of well-documented reports, we are forced to ask whether the workings of the universe might indeed occasionally be twisted and the odds against chance manipulated to obtain desired results. Some recent research by the author in an entirely (until now) unrelated field suggests such interference with normal probabilities is considerably more common than we might expect. And that ‘emotion’, normally so powerful in everyday life, could provide a far greater push against the tyranny of chance than we might reasonably expect.
Baggers
The object of my original academic research was to determine the distribution of growth or decline of companies’ share prices over a relatively short period of time. Many investors dream of picking the stock that will multiply 10-fold over a period of time (length unspecified), known technically and affectionately as a ‘ten bagger’. Over the long term (20 years, say) the trend of stock markets is almost always positive, so the patient and lucky could well be rewarded with several 10 baggers. But conversely, of course, for those unwilling to cut early losses, the value of some shareholdings will certainly be decimated over the period.
But what of the short term? What distribution of pluses and minuses, gains and losses, might we expect over a relatively short span of one year - a period of time long-term investors and fund managers generally consider irrelevantly short?
With no experience to suggest any particular outcome, I selected a time range from exactly one year prior to the date of the first trial, namely 30 Jul 2004 to 29 Jul 2005. The results were astoundingly different from chance expectation.
I drew, from the London stock market, the maximum number of shares that were quoted for the entire period. From the main market and AIM (the so-called Alternative Investment Market) combined, the numbers totalled 2571 - more than sufficient for a tidy statistical treatment.
My computer program calculated the price difference of each share over the year, expressing each as a ‘bagger ratio’. For example, if British Petroleum moved from 516p to 629p, its bagger ratio was 1.22.
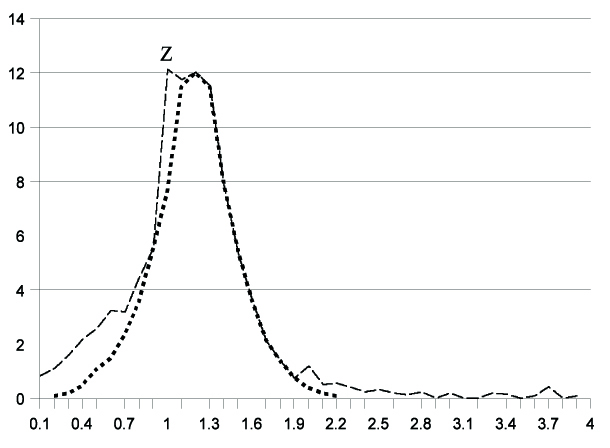
So grouping such ratios into discrete intervals, (for example, any ratio between 2.36 and 2.44 will become 2.4), we are in a position to plot the number of baggers over the year at 0.1 unit intervals. The graph (fig. 1) shows the results, with percentage of total stocks on the y-axis plotted against 0.1 bagger intervals on the x-axis.
The line with long dashes represents the data reported, joined by a best-fit curve. The short-dotted curve suggests what the normal Gaussian distribution might have looked like had the entire data set behaved as chance predicts. Indeed, apart from anomalous plot Z (see Note), the majority of data behaved decently - as Gaussian distribution theory expects - to approximately one standard deviation limit. But beyond that, very fat tails exist in both directions. Indeed, the tail on the right extends right up to 11.5!
I repeated the calculations for data from three previous periods, which gave qualitatively similar results.
A point of considerable relevance is the position of the actual median (1.21 bagger units positive for the most recent range). This is actually as predicted, even taking into account the lengthy anomalous data tails. More relevant, it is exactly the ratio of the finish and start values of the FT All-Share Index (representing the top 750-800 stocks) - 1.21. Precisely head on for what we might expect of the core data in a bull (rising) market. It’s the tails that should concern us more, for no less than 20% of the results lie outside chance expectation on the standard distribution model.
In round figures, probability theory suggests a 1 in 1000 chance (0.1%) probability) of finding a 1-year bagger 2.4 units or beyond.
In this experiment I encountered 3.44% - some 34 times greater probability. And this figure becomes considerably more favourable as we move to higher bagger levels. The chance of finding a bagger beyond 8 is 108 and beyond 11, 1015, yet my data exhibit many instances. Figures in the table have been rounded for simplicity.
Odds against chance for each Bagger Ratio
| Bagger Ratio | Number of Events | Percentage of Total | Powers of 10 against chance |
| 2 | 420 | 16.33 | 1.4 |
| 3 | 46 | 1.79 | 2 |
| 4 | 23 | 0.89 | 3 |
| 5 | 7 | 0.27 | 4 |
| 6 | 2 | 0.08 | 5 |
| 7 | 1 | 0.04 | 7 |
| 8 | 1 | 0.04 | 8 |
| 12 | 1 | 0.04 | 15 |
My bagger data relate to a short period of one year, and almost certainly the number of extreme baggers is likely to increase if we lengthen the observation period to 2, 5, or 10 years. But even in this short time, the odds against chance of finding such relatively extreme baggers are very much of the same order of magnitude as those demonstrated in psi experiments.
Mandelbrot
None of the bagger revelations would be likely to surprise Benoit Mandelbrot, for it was on financial data such as these that he cut his dentate fractals. His set of famous observations concerned the probability of daily stock market moves of various magnitudes.
On 19 October 1987, the US Dow Jones share index fell 29.2% on a single day. The odds of such a mammoth fall, using standard financial models, are 1050against, a number so large as to be outside the scale of nature.
So he concluded, for various reasons (Oakey, 2005), that share price returns are far from following the bell curve:
- Market price changes are not independent of each other - unlike sizes of random pebbles on a beach. They have a sort of memory and today’s performance is likely to affect tomorrow’s. If prices take a big leap up or down today, there is a measurably greater likelihood that they will move just as violently the next day - in either direction.
- Prices do not glide but often leap - a sharp contrast with Gaussian distributions. Unlike the distribution of IQ scores, which grade slowly, share prices can often jump from 50p to 80p, or flop to 30p without trading at prices in between, as market participants attempt to guess new levels.
- Big gains and losses often concentrate into tiny packages of time, which contradicts standard theory. If we apply the latter, price-sensitive news events should be distributed randomly throughout the lifetime of a company by the normal distribution pattern.
The psi connection
One of Mandelbrot’s explanations for financial anomalies is that market price changes are not independent of each other; they have a sort of memory, and today’s performance is likely to affect tomorrow’s. Researchers have always made the totally unwarranted assumption that card guesses and REG trials are independent of one another, whereas there is absolutely no evidence for this. In fact the opposite may be true. Trials are not undertaken by mechanical robots, but by live, emotionally-charged human beings, with an active interest in the outcome of the experiment.
Connectivity is also referred to in quantum physics, where two distant particles which previously interacted seem to retain some sort of ‘memory’ or ‘link’ with one another, and this observation is often quoted to explain the action of psi.
An experiment
It could be difficult to find convincing support for the grand questions touched upon so far, but as a start, here is a very practical trial to determine whether what we consider as psi can influence markets. Essentially, we should organise a ‘crowd’ of people attempting to influence an REG, employing the twin emotions of greed and fear. Hundreds perhaps; maybe thousands. Not difficult using computer and internet technology.
Participants would ‘invest’ hard cash to try to influence market movements depicted on screen employing an interface normally associated with on-line stock-dealing or spread-betting, indicating apparent success or failure. They would be ‘willing’ movements on the screen graph with actual money, win or lose. The central REG would generate a random walk of market movements (the overall trend could be preset up, down or neutral), which punters would try to influence (up or down).
In reality, there would be absolutely no physical or electronic feedback connection between the user screen and REG, so that any deviation from expectation of the market ‘performance’ by many operators acting in concert would have to involve chance elasticity (another more neutral phrase for psi!). And as part of the experiment we should have to evaluate, among others, the ‘need to win’ element. Are participants merely seeking diversion from boredom or desperately trying to win money to pay the rent?
The consequence
Should this work - even to the slightest extent - the following suggestions become more credible.
- The effect of emotional involvement very obviously distorts the distribution of financial events, so perhaps psi scores may be subject to a similar influence, though maybe on a smaller scale.
- Contrary to previous assumptions, guesses or trials in psi experiments may not be independent of each other, possibly being linked by emotion.
- If evidence can be obtained to support either of these assertions, then another conclusion seems inescapable - generations of parapsychologists have been using suspect mathematics to evaluate their results!
And if standard probability theory is dodgy with respect to psi, what system might be used instead? I am sure I am not the first to suggest fractal algebra, but applying it to the paranormal would be an amusing game to play on a cold winter’s evening.
References
Rhine, J B (1934). Extra-sensory Perception. Boston. Boston Society for Psychical Research.
Irwin, H J, (2004). An Introduction to Parapsychology, 4th edition. McFarland & Company Inc, North Carolina, USA, pp 61-65 &pp 107-110.
Roy, A E (1998). The Challenge of Psychical Research, Proc SPR 58, p 112. Fontana, D (1998). Psychical Research and the Millennium: New Light on the Nature of Man. Proc SPR 58, pp 144-145.
Lumsden-Cook, James. Journal of the Society for Psychical Research, Vol 69.1, number 878, January 2005, p1, Journal of the Society for Psychical Research, Vol 69.3, number 880, July 2005, page 128.
Oakey, Dan (2005). Investors Chronicle, 29 Jul, Masterclass page (x). Mr Bearbull (2005). Investors Chronicle, 26 Aug, page 26.
Sheldrake, Rupert (2003). Journal of the Society for Psychical Research, Vol 67.3, Number 872, page 184.
Note: The anomalous point Z is explained almost totally by rounding errors bunched together. Included are many low-priced stocks which equally could have been distributed at 0.9 or 1.1. My stock prices are quoted to just one decimal place, which prevents any detailed reallocation.
Acknowledgement: Grateful thanks to James Clark for helpful discussion and references.